
Data Science & Business Analytics
Turning Data into Insights. Driving Decisions. Creating Business Value.
Artificial Intelligence is transforming the way organizations operate, compete, innovate, and serve their customers. From marketing and financial analysis to management, customer service, and entrepreneurship, AI is creating new opportunities for businesses of every size.
Data has become one of the most valuable resources in modern business. Organizations use data to understand customers, identify market trends, measure performance, improve operations, manage risk, and make better strategic decisions.
The Data Science & Business Analytics course at CA Institute introduces students to the principles and practical applications of data analysis in contemporary business environments. Students explore how data is collected, organized, interpreted, and transformed into meaningful information that supports business planning and decision-making.
Through guided exercises, practical demonstrations, business case studies, and an applied final project, students develop skills in data interpretation, statistical reasoning, data visualization, business intelligence, performance measurement, and introductory predictive analytics.
The course combines analytical thinking with practical business applications. It is designed for students, professionals, and entrepreneurs who want to understand how data can reveal opportunities, solve problems, and improve organizational performance.
Course Overview
Course Title: Data Science & Business Analytics
Course Code: DSBA 201
Course Level: Undergraduate / University Foundation — Applied Intermediate
Recommended English Proficiency: CEFR B1–B2
Proposed Credit Value: 3 U.S. Credits / 6 ECTS
Proposed Contact Hours: 45 hours
- Lectures: 25 hours
- Seminars and practical sessions: 20 hours
Language of Instruction: English
Recommended Duration: 15 weeks
Prerequisites: No previous professional experience in data science or business analytics is required. Basic computer literacy, an interest in business, and a willingness to work with data are recommended. Previous experience with spreadsheets may be helpful but is not required.
Academic level, course code, credits, contact hours, and prerequisites are proposed and should be confirmed by CA Institute before publication as official course specifications.



Course Description
This course provides an introduction to the methods, tools, and applications of Data Science & Business Analytics. Students examine how organizations use data to understand business performance, identify patterns, evaluate opportunities, and support evidence-informed decisions.
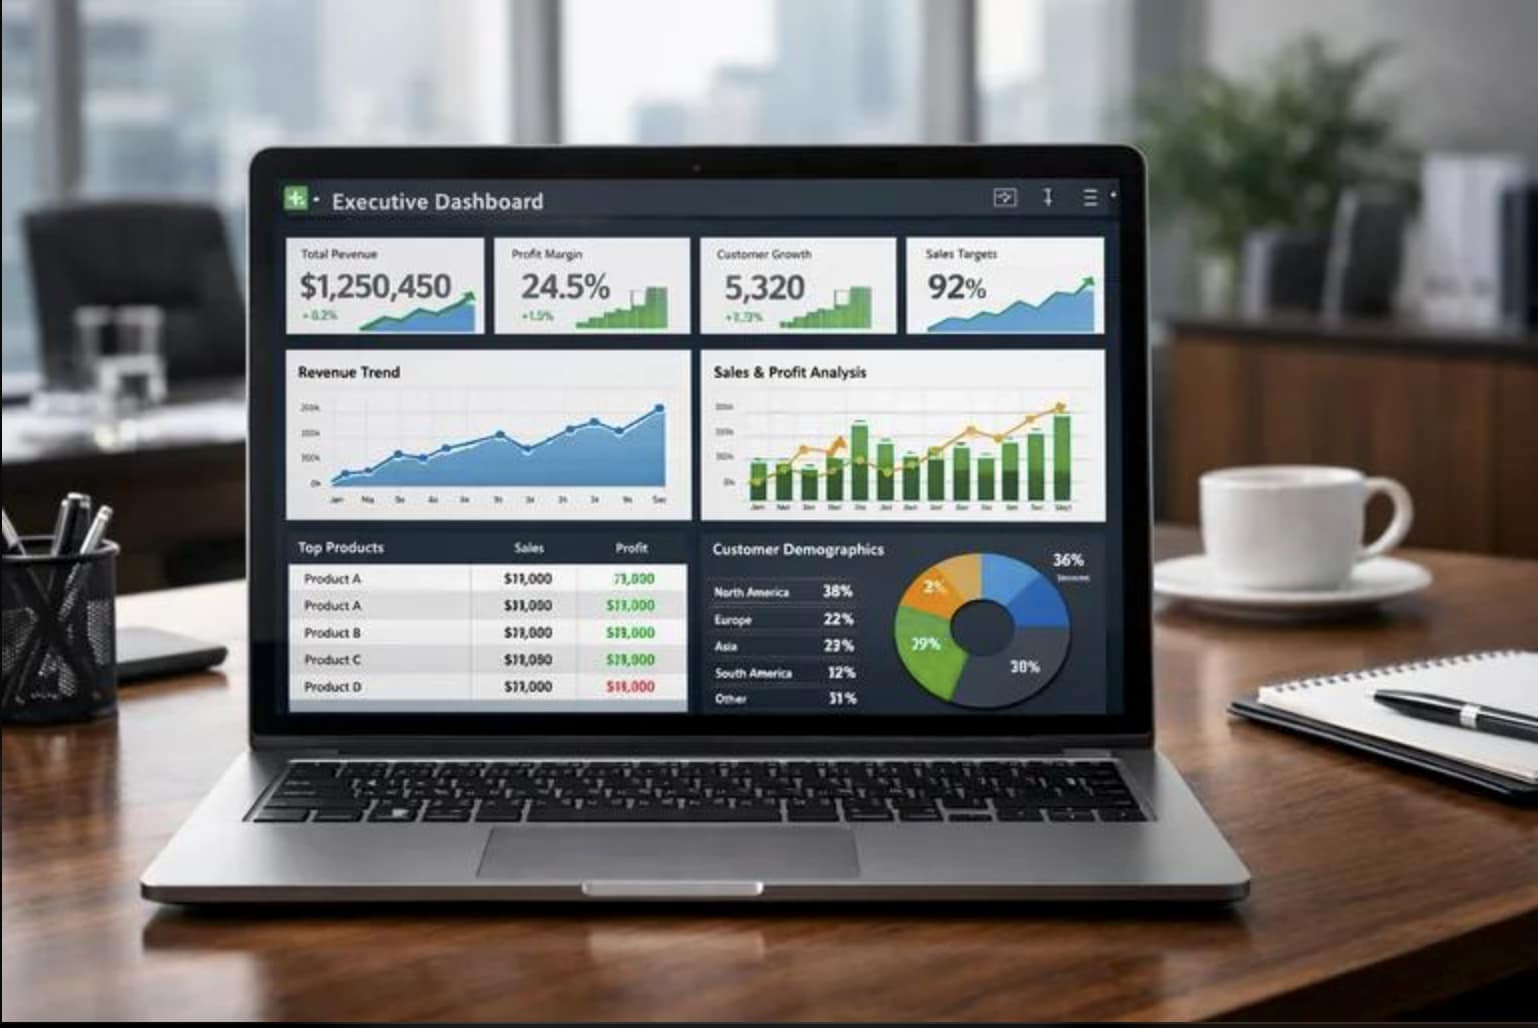
The curriculum introduces data collection, data quality, descriptive statistics, spreadsheet-based analysis, data visualization, key performance indicators, business intelligence, and introductory forecasting. Students learn how to organize information, interpret numerical results, recognize trends, and communicate findings through clear reports and visual presentations.
Through practical exercises and business case studies, students explore how analytics can support marketing, finance, sales, operations, customer experience, and strategic management. They investigate how organizations can measure performance, understand customer behavior, compare alternatives, and identify areas for improvement.
The course also introduces predictive analytics and the role of Artificial Intelligence in data analysis. Students consider how analytical tools can support forecasting and pattern recognition while learning to recognize the limitations of automated recommendations and AI-generated insights.
Responsible data use is an important component of the course. Students examine data quality, privacy, confidentiality, bias, ethical considerations, and the importance of communicating analytical results accurately.
The emphasis is on practical analytical understanding and business applications rather than advanced mathematics or software engineering. Students completing the course will have a foundation for further study in data science, business analytics, business intelligence, management, finance, and digital transformation.
Course Objectives
The course aims to:
- Develop an understanding of the principles of Data Science & Business Analytics.
- Explain the role of data in modern organizations and business decision-making.
- Introduce methods for collecting, organizing, cleaning, and interpreting business data.
- Develop foundational knowledge of descriptive statistics and basic statistical reasoning.
- Introduce practical approaches to spreadsheet-based data analysis.
- Develop skills in data visualization, reporting, and communicating analytical findings.
- Explain the use of key performance indicators and business intelligence dashboards.
- Explore applications of analytics in marketing, finance, sales, operations, and management.
- Introduce forecasting, trend analysis, and predictive analytics at an introductory level.
- Examine how AI tools can support data analysis and where human verification remains essential.
- Develop critical awareness of data quality, privacy, bias, and responsible data use.
- Prepare students to complete an applied business analytics project and present evidence-informed recommendations.
Learning Outcomes
Upon successful completion of the course, students will be able to demonstrate the following competencies.
Knowledge & Understanding
- Define Data Science, Business Analytics, Business Intelligence, and related concepts.
- Explain the relationship between data collection, analysis, interpretation, and business decisions.
- Distinguish between descriptive, diagnostic, predictive, and prescriptive analytics.
- Explain the purpose of descriptive statistics and basic measures of variation.
- Identify common sources of business data and potential quality issues.
- Describe how organizations use metrics, reports, dashboards, and analytical models.
Technical & Analytical Skills
- Organize and examine a basic business dataset using appropriate analytical tools.
- Identify missing values, inconsistent entries, and potential data-quality problems.
- Calculate and interpret basic measures such as averages, percentages, and growth rates.
- Recognize trends, patterns, relationships, and unusual observations in business data.
- Create and interpret appropriate charts, tables, and data visualizations.
- Develop basic reports and dashboard concepts using business performance indicators.
- Interpret introductory forecasting results and recognize their limitations.
- Use AI-assisted analytical tools where appropriate while verifying the accuracy of outputs.
Business & Decision-Making Skills
- Identify business questions that can be investigated through data analysis.
- Select relevant indicators for evaluating organizational performance.
- Interpret analytical findings in relation to business objectives.
- Compare alternative business decisions using available evidence.
- Identify opportunities to improve performance through data-informed recommendations.
- Communicate analytical results clearly to technical and non-technical audiences.
Ethical & Critical Awareness
- Recognize how incomplete, inaccurate, or unrepresentative data can affect conclusions.
- Explain the importance of data privacy, confidentiality, and responsible data handling.
- Identify potential bias and misleading interpretations in analytical results.
- Distinguish between correlation and causation at an introductory level.
- Evaluate the limitations of forecasts, dashboards, and automated recommendations.
- Explain why transparency and human judgment remain important in business analytics.
Academic & Professional Communication
- Use key data science and business analytics terminology accurately in English.
- Describe data patterns and statistical findings using clear language.
- Prepare a structured analytical report supported by data and visual evidence.
- Present business recommendations based on an analysis of a defined problem.
- Evaluate claims and conclusions using critical, evidence-informed reasoning.
Course Content — Indicative 15-Week Schedule
Week 1: Introduction to Data Science & Business Analytics
- What is Data Science?
- What is Business Analytics?
- The role of data in contemporary organizations
- Differences between data, information, and insight
- Examples of analytics across business sectors
- The analytical process: from business question to recommendation
Practical activity: Identify a business question and determine what data could help answer it.
Week 2: Business Data, Sources & Data Quality
- Types of business data
- Structured and unstructured data
- Internal and external data sources
- Variables, observations, and datasets
- Missing values, duplicate entries, and inconsistent information
- Data quality and its influence on business decisions
Practical activity: Examine a sample dataset and identify data-quality issues that could affect an analysis.
Week 3: Descriptive Statistics for Business
- Introduction to quantitative data
- Mean, median, and mode
- Range, variation, and standard deviation: introductory concepts
- Percentages, ratios, and growth rates
- Distributions and unusual observations
- Interpreting numerical summaries in business contexts
Practical activity: Calculate and interpret basic descriptive statistics from a sample business dataset.
Week 4: Data Preparation & Spreadsheet Analytics
- Organizing data into usable formats
- Sorting, filtering, and categorizing information
- Cleaning inconsistent records
- Spreadsheet formulas and basic functions
- Summarizing data using tables
- Preparing datasets for further analysis
Practical activity: Clean and organize a sample sales or customer dataset using a spreadsheet or comparable analytical tool.
Week 5: Data Visualization & Storytelling
- Why data visualization matters
- Selecting appropriate chart types
- Bar charts, line charts, histograms, and scatter plots
- Identifying trends and comparisons
- Avoiding misleading charts and visual representations
- Presenting analytical findings to a business audience
Practical activity: Create a short visual report that communicates important findings from a dataset.
Week 6: Business Intelligence, KPIs & Dashboards
- Introduction to Business Intelligence
- Defining key performance indicators
- Measuring business performance
- Sales, marketing, financial, and operational metrics
- Dashboard design principles
- Monitoring progress toward organizational objectives
Practical activity: Design a basic business dashboard concept using selected performance indicators.
Week 7: Customer, Marketing & Sales Analytics
- Understanding customer data
- Sales performance and revenue trends
- Customer segmentation: introductory concepts
- Marketing campaign measurement
- Conversion rates, retention, and customer behavior
- Using data to identify commercial opportunities
Practical activity: Analyze sample marketing or sales data and recommend an improvement based on the findings.
Week 8: Midterm Review & Assessment
- Review of data science and analytics concepts
- Data preparation and descriptive statistics
- Interpretation of charts and tables
- KPI selection and business performance
- Data quality and responsible interpretation
- Applied business case analysis
Assessment: Midterm knowledge check and practical data interpretation exercise.
Week 9: Financial & Operational Analytics
- Introduction to financial data analysis
- Revenue, expenses, margins, and profitability
- Budget comparisons and variance analysis
- Operational performance indicators
- Identifying inefficiencies and unusual results
- Using analytical evidence to support planning
Practical activity: Examine a sample financial or operational report and identify findings that could inform a management decision.
Week 10: Correlation, Relationships & Business Insights
- Exploring relationships between variables
- Correlation and its interpretation
- Introduction to scatter plots and trend lines
- Recognizing possible confounding factors
- Correlation versus causation
- Avoiding unsupported conclusions
Practical activity: Investigate relationships in a sample dataset and explain what the results do—and do not—demonstrate.
Week 11: Forecasting & Predictive Analytics
- Introduction to predictive analytics
- Trends, seasonality, and historical patterns
- Basic forecasting concepts
- Sales and demand forecasting
- Evaluating forecast accuracy at an introductory level
- Uncertainty and the limitations of predictions
Practical activity: Develop or interpret a simple forecast using historical business data and discuss its limitations.
Week 12: AI, Automation & Modern Analytics Tools
- How AI is used in data analysis
- AI-assisted data exploration and summarization
- Automated reporting and analytics workflows
- Introduction to predictive models and machine learning
- Verifying AI-generated calculations and explanations
- Appropriate uses and limitations of automated analytical tools
Practical activity: Use a guided analytical or AI-assisted tool to explore a dataset and independently verify selected findings.
Week 13: Data Ethics, Privacy & Responsible Analytics
- Data protection and confidentiality
- Responsible collection and use of information
- Bias and representativeness in datasets
- Misleading visualizations and selective reporting
- Security and access to business information
- Transparency, accountability, and ethical decision-making
Practical activity: Evaluate a business case involving data privacy, biased analysis, or a misleading interpretation.
Week 14: Applied Business Analytics Project
- Defining a business question
- Selecting appropriate data and analytical methods
- Preparing and examining a dataset
- Identifying patterns and communicating findings
- Developing evidence-informed recommendations
- Preparing a clear analytical report or presentation
Practical activity: Complete an applied analytics project individually or in a small group.
Week 15: Final Presentations & Course Assessment
- Presentation of student analytics projects
- Explanation of the business question and analytical approach
- Interpretation of findings using charts and numerical evidence
- Evaluation of limitations and potential sources of error
- Presentation of practical business recommendations
- Reflection on further study and professional development
Assessment: Final project presentation and course assessment.
Teaching & Learning Methodology
The course combines foundational concepts with guided practical exercises and real-world business applications.
Teaching methods may include:
- Lectures and structured discussions
- Demonstrations of spreadsheet and analytical tools
- Guided data preparation and interpretation exercises
- Business case studies and scenario analysis
- Data visualization and reporting activities
- Individual and group assignments
- Applied project work
- Student presentations and reflective evaluation
Students are encouraged to approach business questions systematically, examine evidence critically, and communicate their findings clearly. Practical activities progress from basic data interpretation toward more complex business analysis and introductory forecasting.
The course emphasizes analytical reasoning, practical understanding, and responsible data use. Advanced programming experience is not required, and technical activities can be introduced progressively using appropriate guided tools.
Assessment & Completion Requirements
Student progress may be assessed through a combination of:
- Class participation and practical exercises: 20%
- Assignments and applied case studies: 25%
- Midterm assessment: 20%
- Final applied project and presentation: 35%
Total: 100%
Students are expected to participate in learning activities, complete required assignments, demonstrate understanding of core concepts, and submit a final applied project.
Successful completion is subject to the attendance, assessment, and academic requirements established by CA Institute for the course.
The proposed assessment weights and completion requirements should be formally approved before publication.
Professional Applications & Further Study
Knowledge of Data Science & Business Analytics can support further study and professional development in a range of business, management, finance, and technology-related fields.
- Potential areas of application include:
- Business Analytics
- Data-Informed Management
- Business Intelligence and Reporting
- Marketing and Customer Analytics
- Financial and Operational Analysis
- Sales Performance Analysis
- Forecasting and Planning
- Digital Transformation
- Data-Driven Strategy
- AI-Assisted Business Analysis
- Operations and Performance Management
- Entrepreneurship and Business Innovation
The course provides an educational foundation for further learning and professional development. It does not guarantee employment or qualification for specialized positions. Career opportunities depend on students’ previous education, professional experience, practical skills, and additional training.
This course may be suitable for:
- Students interested in data, business, and technology
- Business professionals seeking to improve analytical decision-making
- Managers and team leaders who work with performance indicators
- Entrepreneurs who want to understand business data
- Marketing and sales professionals interested in measuring results
- Professionals working with financial or operational reports
- Individuals interested in business intelligence and data visualization
- Learners planning further study in data science, analytics, finance, or management
- Professionals seeking to understand how AI and analytics can support business decisions
No previous professional experience in data science is required. Basic computer literacy, curiosity, and an interest in understanding business performance through data are recommended.
Tuition
Course start date: February 15, 2027
Tuition
One to one classes
22,240 CZK
€890.00 EUR
Tuition
Group classes
15,840 CZK
€659.00 EUR
Specials
Sign up before
February 1, 2027
10% off